A Deeper Analysis of Nintendo’s Financials – Why They Can’t Drop Hardware
Posted on January 17 2014 by Nathanial Rumphol-Janc
Nintendo’s latest financial briefing wasn’t exactly the type of news many wanted to hear, and with Nintendo currently struggling and many calling for Mr. Iwata’s head on a platter, I felt it was important to take a deeper look at Nintendo’s financial trending and history, and why dropping out of the hardware race would be a move that could potentially ruin Nintendo overall, at least as they currently stand. The entirety of this post is going to be a reposting of some analytical work done by Captain Smoker on
NeoGAF. I take no credit for this work, but I merely wanted to share the findings with people who are unable to comment or ask questions about it through their forum.
1. A historical overview
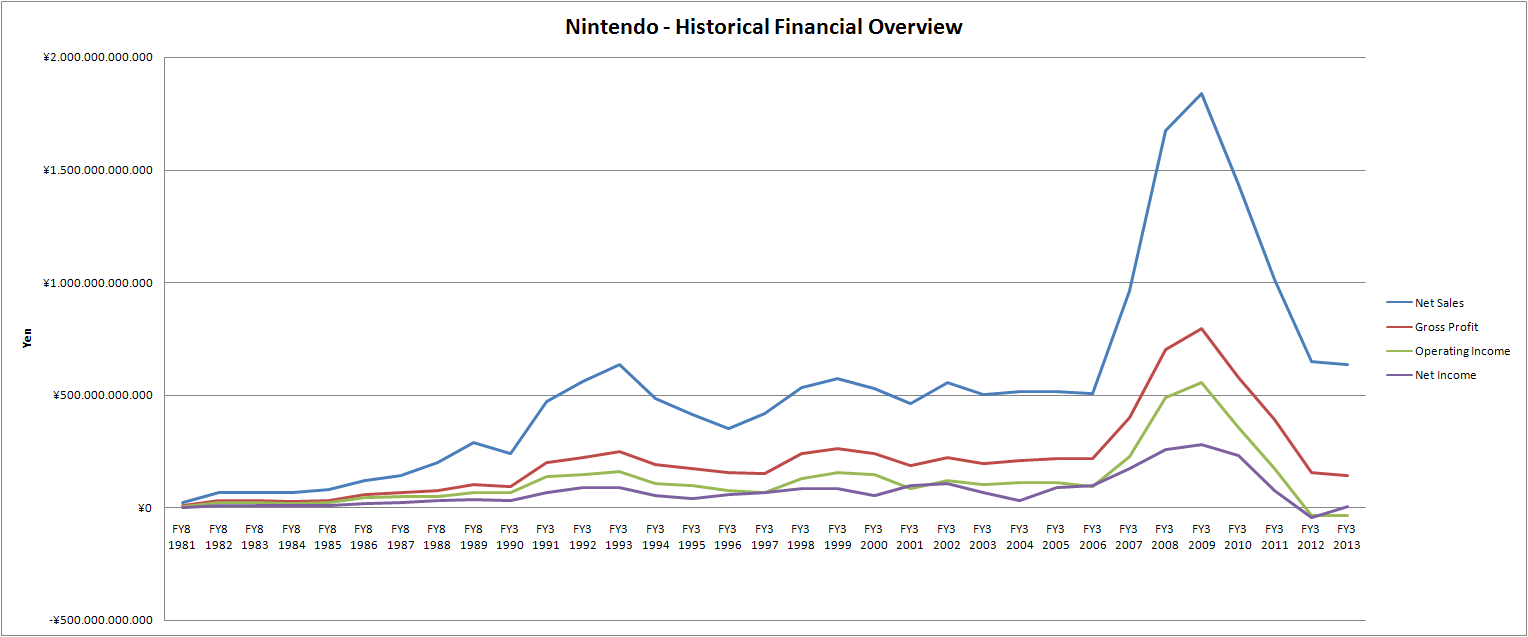
Net Sales
“In bookkeeping, accounting, and finance, Net sales are operating revenues earned by a company for selling its products or rendering its services.
Also referred to as revenue, they are reported directly on the income statement as Sales or Net sales.”
Gross Profit
“In accounting, gross profit or sales profit is the difference between revenue and the cost of making a product or providing a service, before deducting
overhead, payroll, taxation, and interest payments.”
Operating Income
“In accounting and finance, earnings before interest and taxes (EBIT), is a measure of a firm’s profit that excludes interest and income tax expenses.”
Net Income
“In business, net income – also referred to as the bottom line, net profit, or net earnings – is an entity’s income minus cost of goods sold, expenses and taxes for an accounting period.
It is computed as the residual of all revenues and gains over all expenses and losses for the period,”
I think this chart is well known, Nintendo always generated money (aside from FY3 2012), as well as the big Wii & NDS – spike and downfall.
2. Revenue breakdown
As you can see, the net sales graph is Nintendos revenue generated by their products. Going deeper into their files you can find a breakdown of their revenues. Unfortunately, Nintendo started with the breakdowns with FY3 2001, so we don’t have data prior to this, but here’s the current chart:

Most surprisingly, Nintendo generates more revenue with their hardware (consoles + handhelds + accessories + other) than with their software (retail + digital + royalties). You have to consider that Wii & NDS have combined software sales of 1.802.750.000 units. Considering this, you can say that people saying that Nintendo should abandon their hardware is quite a crazy idea, because it makes up to 60% of their business.
Furthermore, their hardware gives them a base for their own software sales, for accessory-sales, royalties and the possibility for their own online infrastructure (I’ll come back to the online infrastructure later). Nintendo managed to ship around 700.000.000 of it’s own software titles during their Wii & NDS – age and still didn’t manage to generate higher revenues than their hardware, of course, Wii & NDS had great hardware sales, but unlike the first year in the chart, hardware beats software every time.
From a financial point, one crucial thing for Nintendo is that they sell their hardware beneath the production price, one problem that occurred with the 3DS (resolved by now) and the Wii U (still sold under price) and one of the big reasons why they generate operating losses in the last few quarters. People saying that Wii U should be 200 $ or less is wishful thinking and not really an option considering this. It’s their fault though, because they should’ve planned this better (and other things like marketing, etc.), but okay, this is quite an unpredictable market if you want to predict long term sales.
3. Hardware revenue breakdown
So, let’s analyze the hardware revenues even further:
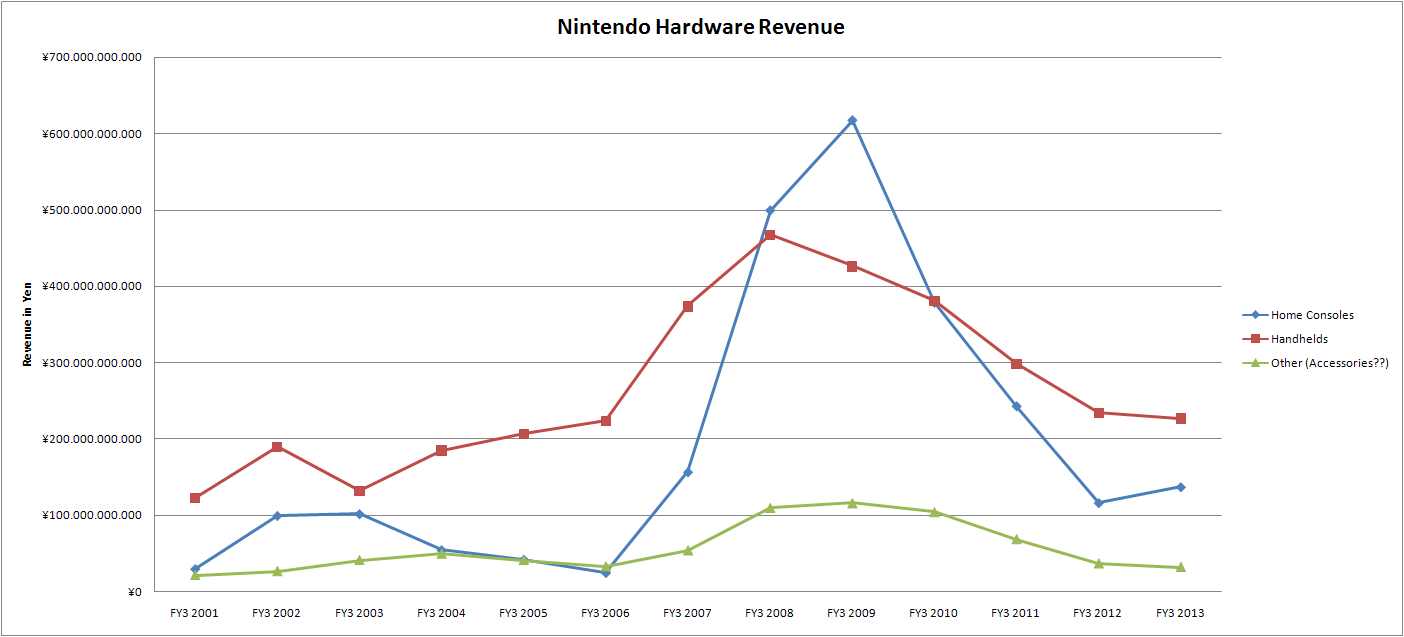
There’s a section in the report called “Other”, I suppose these are accessories and maybe other things I can’t think of now. It’s quite unfortunate that we don’t have older reports, but you could say that Nintendos hardware business during the GCN-days was mostly driven by the handheld-division, hence, even the “Other-section” generated more revenue than the GCN.
The Wii is somewhat of an anomaly, it even managed to outpace the NDS in two years, thanks to the high sales and higher price-point. It would’ve been quite interesting to see the breakdown for the NES-, SNES- and N64-generation, in comparison to the Game Boy and Game Boy Color.
4. Software revenue breakdown
Now, lets move on to the software:

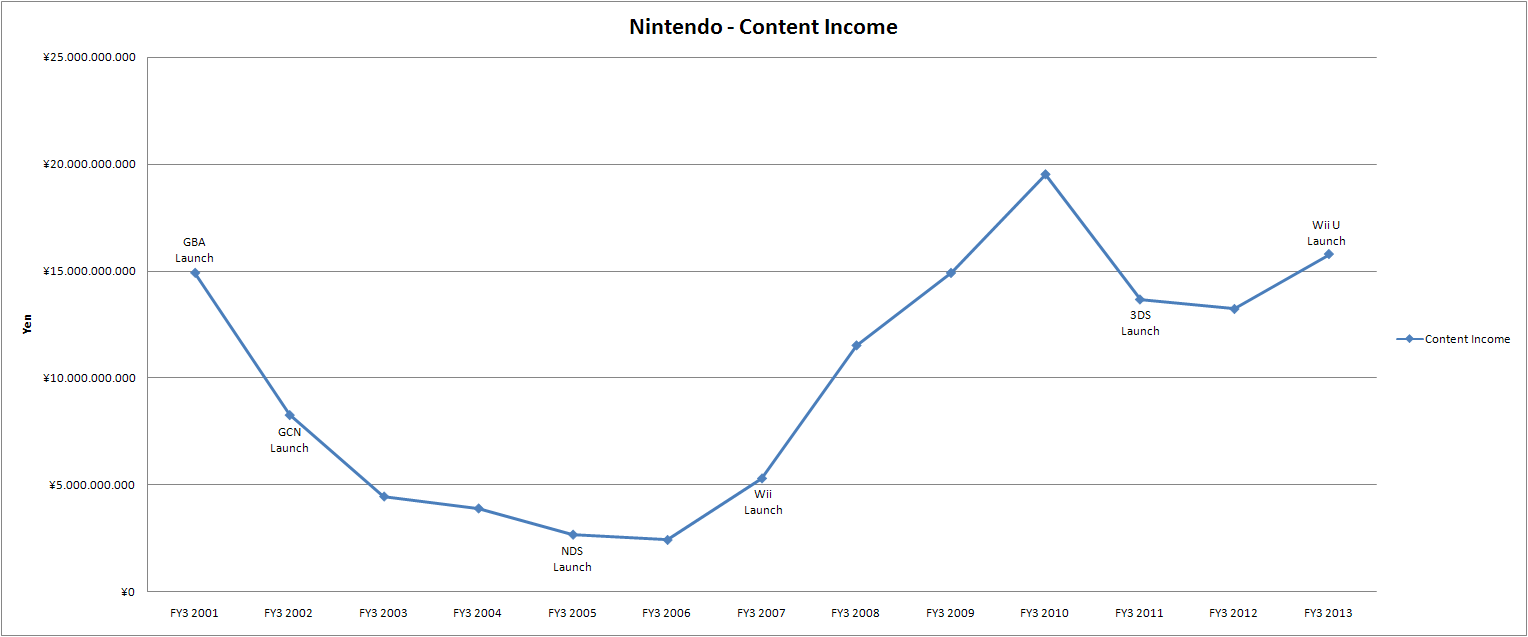
It’s quite similar to the hardware graph, but one thing got me interested. There’s a section in the reports that’s called “Content income”, looking through older reports, it was declared as “royalties & content income”, I think it’s still the same.
So I believe these are the 3rd Party licencing fees that Nintendo earns. If you have further information what this could be, please elaborate.
Most surprisingly for me is the fact that Nintendo generates like 10 to 100 times more revenues with their own software than with 3rd Party royalties (Content income). The 3rd Party sales on the Wii & NDS havn’t been bad at all (considering the overall mass).
Nintendo Software Revenues
to 3rd Party Earnings Ratio:
- FY3 2001 18,0
- FY3 2002 27,7
- FY3 2003 50,0
- FY3 2004 56,3
- FY3 2005 82,4
- FY3 2006 92,1
- FY3 2007 70,6
- FY3 2008 50,4
- FY3 2009 44,3
- FY3 2010 28,1
- FY3 2011 28,4
- FY3 2012 18,6
- FY3 2013 14,0
So, compared to Nintendo’s own revenues, the content income graph seems absimal, so I created another chart for this, because these are still hundreds of millions of dollars:
And to give you a clue how much this is in Dollars, here’s another breakdown (I used historical exchange rates, so the curve should look different than the original):
(…)
FY3 2007: 45.340.000 $
FY3 2008: 100.800.000 $
FY3 2009: 148.378.000 $
FY3 2010: 210.120.000 $
FY3 2011: 159.490.000 $
FY3 2012: 167.440.000 $
FY3 2013: 190.320.000 $
I think it’s interesting that the chart is still quite high since the 3DS launch, because overall software sales are far behind what NDS & Wii achieved, I have no explanation for this.
5. Profitability / Gross profit ratio
So, moving to another topic and discussing Nintendo’s
direct hardware & software profitability. One of Nintendo’s secrets of their success (over 36 years in the gaming market and only one year with net loss) is the well known fact that
they sell their hardware for more than the production price. (3DS & Wii U being the exception). Furthermore, their software margins are extremely high because they don’t have to pay royalties and don’t have to share the price between developer & publisher.
I already mentioned what the gross profit is:
Gross Profit
“In accounting, gross profit or sales profit is the difference between revenue and the cost of making a product or providing a service, before deducting
overhead, payroll, taxation, and interest payments.”
The gross profit ratio gives us a clue about Nintendo’s profitability in terms of direct production costs compared to their revenue:
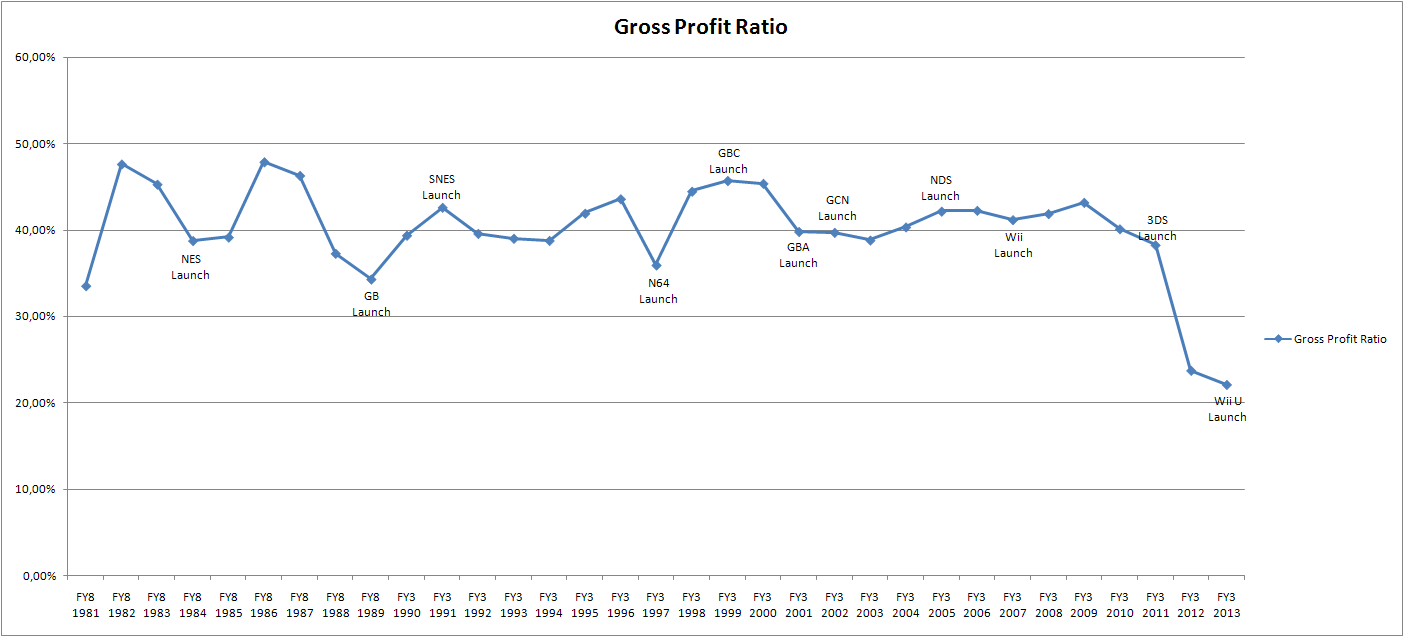
The graph shows us that Nintendo always worked around a gross profit ratio of 40%. One of the reasons why Nintendo earned money during the GCN-days, while Sony made loss, despite PS2 being the best selling home system to date. Now, if you look at this, gross profit ratio always declined a bit with the release of new hardware, which is logical, because they’re selling it at a price near to the production price, higher sales give them lower production costs and better margins, so they increase again until the next hardware release.
But there’s one anomaly if you look at the end and these are 3DS & Wii U. It’s well known that both products didn’t follow the “selling price > production price” route. While they resolved this problem with the 3DS, the Wii U is still being sold at loss. This is currently Nintendos biggest problem in terms of profitability and one reason why Nintendo won’t cut the Wii U – price by a big amount (I suppose).
6. Plans to enhance the profitability again
So, you have to consider that Nintendo has low-margin-hardware & higher production costs for their software thanks to the HD-age. And their research & development expenses are also steadily increasing. What can they do or what will they do Because of this problem, Iwata took some actions to increase the profitability again, but these are more or less mid- to long-term things:
- You probably know that Nintendo builds a new R&D-building next to their Kyoto-headquarters. The construction of the facility costs about 200.000.000 $ (this is also something that disturbed their profitability in the last years) and it should be finished by now or in the next few months. The new facility can host more than 1.500 employees and it’s probably used to enhance their software development and overall efficiency.
- And they also started to unify their development divisions, quoting Iwata: “As you might already know from some newspaper reports, we will reorganize our development divisions next month for the first time in nine years. Two divisions which have independently developed handheld devices and home consoles will be united to form the Integrated Research & Development Division, which will be headed by Genyo Takeda, Senior Managing Director.
- Last year we also started a project to integrate the architecture for our future platforms. What we mean by integrating platforms is not integrating handhelds devices and home consoles to make only one machine. What we are aiming at is to integrate the architecture to form a common basis for software development so that we can make software assets more transferrable, and operating systems and their build-in applications more portable, regardless of form factor or performance of each platform. They will also work to avoid software lineup shortages or software development delays which tend to happen just after the launch of new hardware. Some time ago it was technologically impossible to have the same architecture for handheld devices and home consoles and what we did was therefore reasonable. Although it has not been long since we began to integrate the architecture and this will have no short-term result, we believe that it will provide a great benefit to our platform business in the long run.”
- Reducing Wii Us production costs (they plan this, but I have no idea how, maybe better contracts)
- Driving the online business
7. Online business
Nintendo’s online business saw a big growth in the last quarters/years:

Currently, it even makes up 10% of their overall software business:
Digital Software
Revenue Percentage
- FY3 2007 0,61 %
- FY3 2008 1,32 %
- FY3 2009 1,46 %
- FY3 2010 2,10 %
- FY3 2011 1,99 %
- FY3 2012 3,02 %
- FY3 2013 6,90 %
- FY3 2014 10,92 %
In this case, Nintendos software margin is 100%, so it’s quite obvious that they push this segment. Maybe this is an explanation for Nintendos big indie-shift with the 3DS & Wii U now that they see the benefits of their online-segment.
(Note: This has not been updated with today’s latest financials, though the relevancy of the research and analysis doesn’t change the overall perspective)
